Colorado Natural Heritage Program Logo Colorado Natural Heritage Program Logo CNHP
  • About Us
    • About Us
      • Biennial Report
      • Strategic Plan
    • Conserving Biodiversity
    • Contact Us
    • Staff Directory
    • Careers
      • Employment
      • Internship
      • Volunteer
    • Meetings
    • The NatureServe Network
    • Partners
  • Our Work
    • Ecology
    • Wetlands
    • Plants
    • Animals
    • Climate Change
    • Education
    • Invasive Species
  • Our Services
    • Database Development
    • GIS Analysis & Modeling
    • Mapping
    • Surveys & Inventories
    • Monitoring & Assessment
    • Conservation Planning
  • Our Data
    • About CNHP Data
    • Request Data
    • Contribute Data
    • Download Data
    • Tracking Lists
    • PCA Reports
    • Help & Documentation
  • Maps
    • CNHP Spatial Layers
    • Wetlands Mapper
    • COMaP
    • Conservation Environmental Review Tool
  • Library
    • Reports
    • PCA Reports
    • Tracking Lists
    • Field Guides
      • Rare Plant Guide
      • Colorado Wetland Field Guides
  • Blog
  • Donate Now

Field techniques – Frequency

March 23, 2010

CNHP ecologists use frequency of occurrence as a measure of plant community composition, especially if we want to know how the community is changing over time.

Reading a frequency frame placed along a transect.

Frequency is usually expressed as a percentage, such as the percent of all plots in which a species is present, or the percent of cells in a grid that contain the species. It is a presence/absence measurement, and does not reflect the number of individuals or the area they cover. A little reflection tells us that frequency is highly dependent on the size of the area being observed – if our sample frame is the size of the earth, every species has a frequency of 100%!

Since we don’t always know in advance what size frame will be appropriate for detecting changes in species frequencies, and because some species are much bigger than others, it is common to use a “nested” frequency frame like this, placed at many different locations in the area being studied:

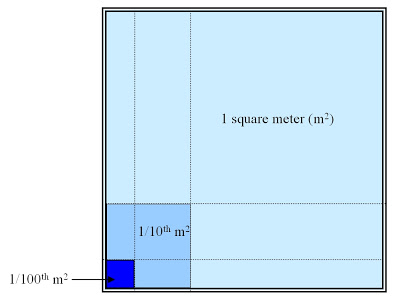
This frame can easily be made out of plastic pipe and elbow fittings. Divisions can be marked with strings, or marks along the frame edge. To read the frame, record a 1 if the species is in the smallest square, a 2 if it is in the 1/10th m square but not the 1/100th, and a 3 if it is only in the largest square outside the other two squares. A species that gets a 1 is present in all three frame sizes, but a species with a 3 is only present at the largest frame size. Calculate the percent of “present” frames for each species at each size frame. To detect change over time, a frame size that gives a percentage between 20 and 80 is best.

Quiz time! Assuming the nested corner is upper left in the photo,
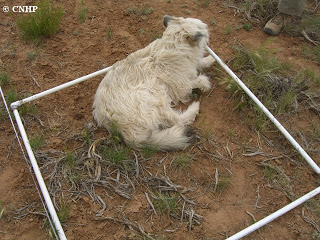
is the dog is a 1, 2, or a 3?
(A: we’re sampling plants here, shoo!)

SHARE
FACEBOOK
TWITTER
LINKEDIN
REDDIT
EMAIL
Filed Under: Field Techniques

New Zoology Field Technician positions open
2009 Southeast Colorado survey report now available

About Us

About Us
Conserving Biodiversity
Contact Us
Staff Directory
Careers
Employment
Internship
Volunteer
Meetings
The NatureServe Network
Partners

Our Work

Ecology
Wetlands
Plants
Animals
Climate Change
Education
Invasive Species

Blog Archive

Blog Categories

Web Projects

  • Rare Plant Guide Online
  • Colorado Wetland Info Center
  • COMaP - Colorado Protected Lands
  • Colorado Bat Working Group
  • STReaMS - Endangered Fishes Database

About Us

  • About Us
  • Conserving Biodiversity
  • Contact Us
  • Staff Directory
  • Careers
  • The NatureServe Network
  • Partners
  • Site Map
Warner College of Natural Resources Logo
  • Apply to CSU
  • Equal Opportunity
  • Disclaimer
  • Privacy Statement
  • Search CSU
  • CSU Land Acknowledgement
  • CSU Principles of Community
© 2026 Colorado Natural Heritage Program
Colorado State University Logo
  • About Us
    ▼
    • About Us
      ▼
      • Biennial Report
      • Strategic Plan
    • Conserving Biodiversity
    • Contact Us
    • Staff Directory
    • Careers
      ▼
      • Employment
      • Internship
      • Volunteer
    • Meetings
    • The NatureServe Network
    • Partners
  • Our Work
    ▼
    • Ecology
    • Wetlands
    • Plants
    • Animals
    • Climate Change
    • Education
    • Invasive Species
  • Our Services
    ▼
    • Database Development
    • GIS Analysis & Modeling
    • Mapping
    • Surveys & Inventories
    • Monitoring & Assessment
    • Conservation Planning
  • Our Data
    ▼
    • About CNHP Data
    • Request Data
    • Contribute Data
    • Download Data
    • Tracking Lists
    • PCA Reports
    • Help & Documentation
  • Maps
    ▼
    • CNHP Spatial Layers
    • Wetlands Mapper
    • COMaP
    • Conservation Environmental Review Tool
  • Library
    ▼
    • Reports
    • PCA Reports
    • Tracking Lists
    • Field Guides
      ▼
      • Rare Plant Guide
      • Colorado Wetland Field Guides
  • Blog
  • Donate Now