If you’ve read any descriptions of ecological communities you may have noticed that the species composition is often expressed as percent cover. CNHP ecologists and botanists make frequent use of this measurement during field surveys of the habitats of rare plants or animals, as well as using the numbers to describe plant community occurrences.
Cover is usually measured as either basal cover – the area that the stems of plants cover on the ground, or aerial cover – sort of the bird’s-eye view of how much ground is obscured by vegetation. Percent cover can be measured with a variety of techniques and equipment, most of which are expensive in terms of time and/or money. Visual estimation of cover is quick, but has the potential to introduce observer bias. Most of us have no trouble distinguishing between 1% cover and 50% cover, but when faced with assigning a percentage to an un-measured plot, our estimates can vary widely.
Field ecologists often have to “re-calibrate” their eyes at the beginning of the field season, or when training new crew members by using careful measurements of sample plots. Here are three examples of different cover levels between 1% and 50%. See if you can match the correct percent to each example from the following choices: 1%, 3%, 5%, 10%, 15%, 20%, 50%.

(B)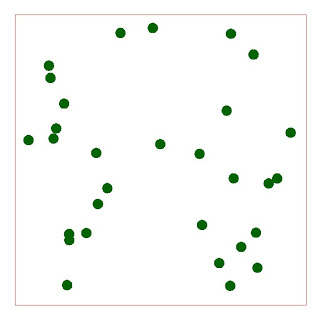
(C)
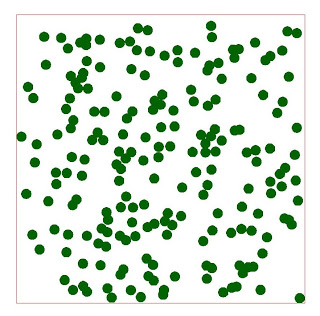
Answers appear below (keep scrolling).
(A) = 10% (B) = 3% (C) = 20%
How well did you do?